Demodulation — also known as enveloping — is one of the most powerful tools in a vibration analyst’s toolkit, especially when it comes to detecting rolling element bearing and gearbox faults. It doesn’t replace narrow band spectral analysis, but it often reveals what the spectrum misses, especially in the early stages of a fault.
This article takes a practical look at what demodulation is, how it works, and why it’s worth your attention.
Some Attributes of Demodulated data
One important attribute of demodulation (or demod) data is that it focuses on high frequency vibration. Using a high pass filter, low frequency data is filtered out and a data collector is able to “zoom in” on low level high frequency vibration. This means that some peaks that would otherwise be lost in the noise floor of a normal narrow band spectrum (much lower than the normal vibration a machine emits) can be detected using demodulation techniques.
Another feature of demod, or of high frequency vibration in general, is that it is easily attenuated and does not travel well through a machine’s structure (termed the “disco effect”). As one moves away from a loud music source, one tends to hear only the bass, or low frequency sound, since the treble or high frequency sounds dissipate rather quickly. This implies that vibration detected with demod is usually produced locally. In the case of a motor driving a pump through a coupling, demod data collected on the pump end will usually reflect the vibration emitted by the pump end.
Lower frequency vibration may be transmitted through the coupling and may even be amplified on the other end of the machine depending upon its mobility. It is my experience that the existence of higher amplitude bearing tones on one side of the machine (at the same frequencies) does not necessarily mean that this is the side of the machine with the faulty bearing! (Refer to figures 4 – 7).
So, what is Demod?
Demod can be explained by using the following example: Let’s say we have a ball bearing with a fault on the outer race. Every time a ball hits this fault it creates a little “click”. If 7.4 balls hit this fault per revolution we get 7.4 “clicks” per revolution. We would expect to see a peak in the narrow band vibration spectrum at 7.4x (a frequency equal to 7.4 x the shaft speed).
If we were using only narrow band spectral data, this is where we would find the peak in the spectrum relating to this particular bearing fault.
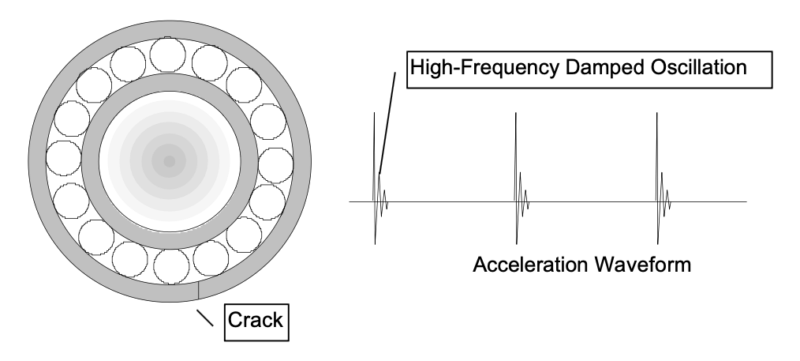
Figure 1. Perhaps there are 7.4 of these “clicks” above per revolution of the shaft.
However, something else is happening. What is this “click”? What is the sound the bearing makes when a ball hits this fault? To answer this, we only have to think of the bearing as a bell. The sound it makes when a ball hits the fault is the same sound the bearing makes when you hit it with a hammer. This is called its resonant frequency and it is usually high in frequency, although it depends on the mass and stiffness of the bearing’s structure.
Now we can look in a different place for information about this fault. Let’s assume that the bearing or “bell” is ringing all the time and when a fault gets hit by a ball or it gets “clicked” it simply rings louder. This is called Amplitude Modulation. The process of demodulation focuses on the frequency being rung and the rate at which it rings louder. It removes the frequency or “sound” of the ringing itself (high frequency) and returns the rate at which it is getting rung (7.4 times per revolution of the shaft). In other words, we can arrive at that same 7.4 x frequency by looking at high frequency data, and see the same bearing tone by looking in a different frequency range of the vibration data.
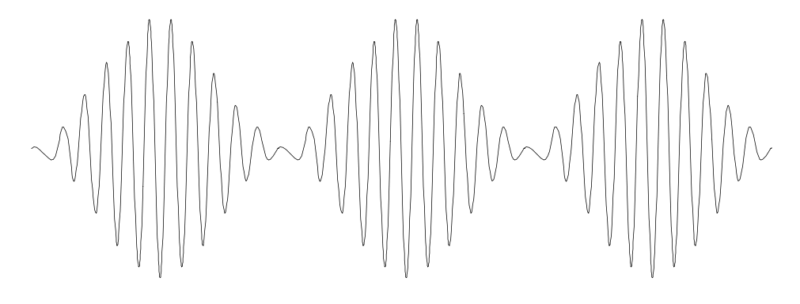
Figure 2. What are the “clicks”?
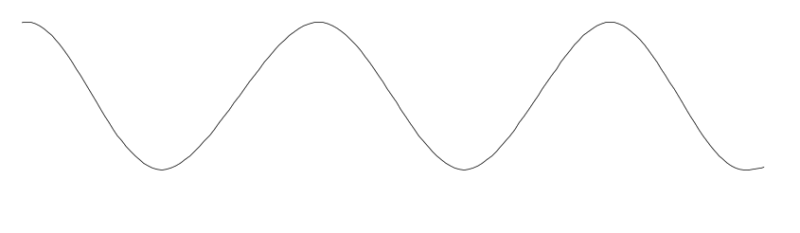
Figure 3. What is the repetition rate of the “clicks”?
Pumps, Blowers and a lot of noise
Summarizing, we can see the effects of the balls hitting this fault in two different places and in two different ways. One can think of it as the number of events per revolution of the shaft:
If 7.4 balls hit the fault per revolution of the shaft I will see a peak in the vibration spectrum at 7.4x the shaft rate.
Or we can look at it in terms of the resonant frequency of the bearing housing (or accelerometer): The sound of the bearing housing ringing has gotten louder 7.4 times per revolution of the shaft, and if I demodulate this signal I will be left with a peak at 7.4x.
These are essentially two different ways of arriving at that 7.4x, which tells us a problem is developing in the bearing.
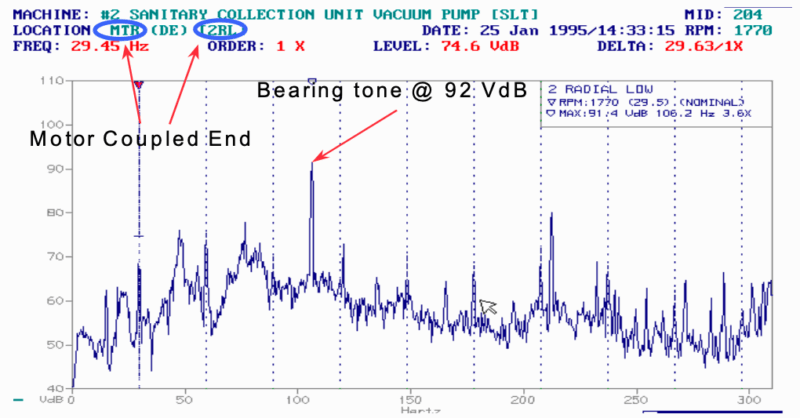
Figure 4. A narrow band spectrum with a bearing tone at 3.6x
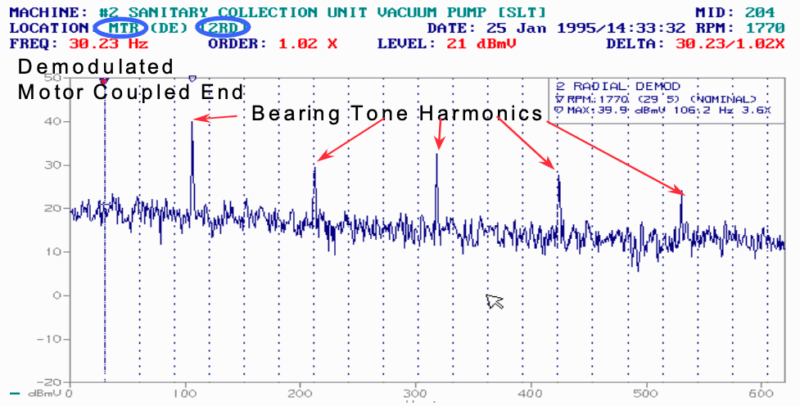
Figure 5. A Demod spectrum displays the same bearing tone with harmonics
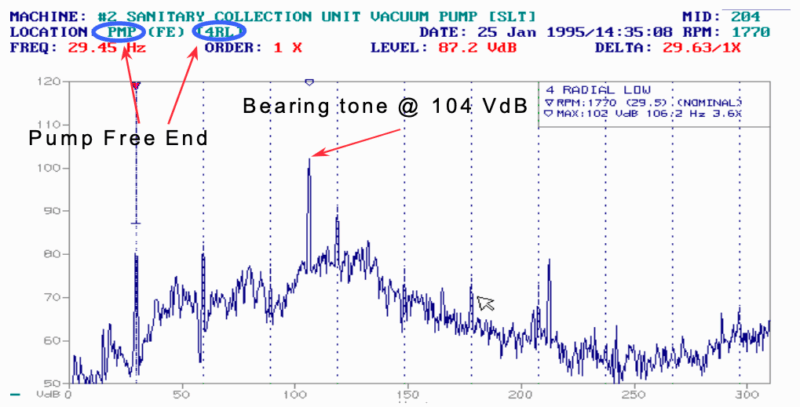
Figure 6. Narrow band Spectrum at the pump end of the same machine. Note the presence of the same bearing tone of higher amplitude. If collecting only narrow band spectral data, an assumption would be made that the fault is in the pump bearing.
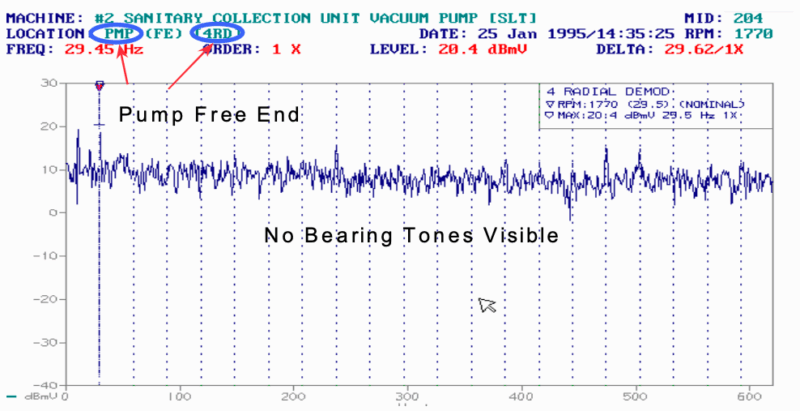
Figure 7. The demod data on the pump end does not have the bearing tones, while the demod on the
motor end has a direct match (Figure 5). Which bearing is faulty?
Complimentary Approaches
The question is: If I can identify a bearing problem with one technique, why do I have to consider an alternative?
Once reason to use demod is illustrated in its application to a pump or blower. With pumps and blowers you often encounter a lot of flow noise or random vibration that raises the noise floor of the spectrum. You wouldn’t be able to see the bearing tone in the narrow band spectrum unless you used a high pass filter that got rid of most of the noise.
In addition, the raised noise floor produced by flow noise often looks similar to that caused by severe bearing wear. How do you tell the difference if there are no clearly discernable bearing tones in the noise, or if it is uncertain whether little peaks rising up out of the noise floor are bearing tones or not? Demod can be extremely useful in this situation. By filtering out the low frequency noise, we can zoom in on the resonant frequency of the bearing housing to identify the bearing tones…and detect them before they are strong enough to appear in the narrow band spectrum.
Unfortunately, we can’t use demod alone because we do not have enough evidence to claim that the absolute level (the exceedance of noise floor level) of a demod signal provides an indication of bearing fault severity. In fact, I don’t believe we will ever be able to make that judgement. The reason is that demod looks for the rate at which the continuous ringing of the bearing housing gets louder. If this frequency is essentially random due to numerous faults and a lot of bearing noise, then the demod signal also appears to be noise. In other words, if the ringing of the bearing housing just gets louder in general, as opposed to getting a louder in discreet intervals such as 7.4 x per revolution of the shaft, then we are left with nothing. In fact, as the bearing fault gets worse, demod can actually go away!
In addition, the level of a peak in the demod spectrum is simply relative to how much louder the individual “clicks” are as compared to the background ringing of the bearing housing. This ratio alone is not enough to make a correlation to the severity of a fault in the bearing. It actually has more to do with the bearing structure and damping properties than anything else.
Demod as extra information
Demod is certainly useful for a number for reasons. If you see a problem in demod it’s probably a bearing tone. Then you can wait for it to appear in the narrow band spectrum. Conversely, if you see a strange non-synchronous peak (not an exact multiple of shaft rate) in the narrow band spectrum, and you also see it in your demod, you can be sure it is a bearing tone as opposed to external vibration. Finally, if you see bearing tones in the narrow band spectral data from two different locations on the machine at the same frequency, and the demod data has matching peaks at one location (but not the other), you can assume that the common location is the one with the bearing problem.
Demod is also useful for diagnosing rolling element bearing problems in slow speed machines. If you have a machine rotating at 60 RPM (1 Hz) and want to find bearing tones in a range between 3x and 10x, the frequency of these tones will be less than 10 Hz. When using a velocity spectrum, the integration from acceleration to velocity acts like a 10 Hz high pass filter making these lower frequencies less useful. In addition, most vibration data collectors use a 10 Hz high pass filter as a default for this very reason.
Fortunately, demod data will still be valid since the resonant frequency of the bearing will still be a higher frequency. Although outside the scope of this article, it should be noted that using the time waveform is useful in this situation to see the individual “clicks” of the bearing faults in low speed machines.
Demod should not be used in reciprocating machines such as diesel engines or piston driven compressors, due to the high frequency vibration caused by piston impacts. Demod also does not work well in variable frequency drive motors (VFD’s) due to high frequency harmonics of run speed. And, it should not be used in motors with commutators since the impact of the brushes on the commutator also cause high frequency vibration, which interferes with the data.
Author bio
Alan Friedman, a senior technical advisor for Azima DLI, has over 18 years of engineering experience and has worked with hundreds of industrial facilities worldwide, developing best practices for sustainable condition monitoring and predictive maintenance.