
By Alan Friedman
This is Part 3 of our three-part series on linear and non-linear systems in machinery. If you haven’t read Part 1 or Part 2, we recommend starting there. In this post, we’ll explore how real-world machine faults like looseness, bearing wear, and gear problems show up as non-linear responses.
Sidebands in a spectrum are another result of non-linearity. Sidebands are produced by amplitude modulation as shown in Figure 11.
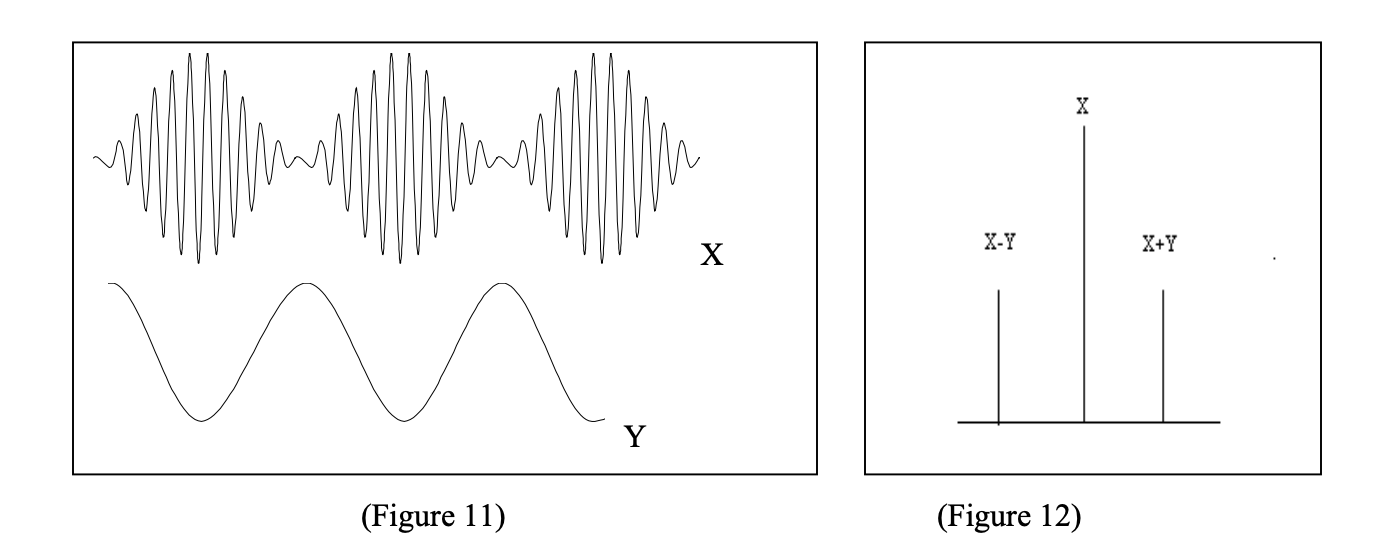
The top waveform in figure 11 is an example of a modulated waveform. What we have here is a wave that repeats itself with a frequency “X”, however, the amplitude of this wave goes up and down at the frequency “Y” of the wave on the bottom of the diagram. The bottom wave is simply included to demonstrate the frequency at which the amplitude of the top wave goes up and down.
If one wishes to visualize this in mechanical terms, consider a set of gears where one gear is not centered on its shaft. Lets say that the non-centered gear has 32 teeth. In one revolution of the non-centered gear we will see 32 tooth impacts. This would relate to frequency “X” above. Since this gear is not centered on its shaft, the amplitude of the tooth impacts will go up and down as the gear moves closer and farther away from the second gear. It will take one revolution of the non-centered gear for the level of the impacts to go from maximum to minimum and back to maximum again. So, the frequency with which the levels of the impacts change (or are modulated) is the rotation rate of the non-centered gear. This would relate to frequency “Y” above.
If we look at the spectrum of these gears (Figure 12), what we will see is a peak at frequency “X” with one peak on either side of it “Y” distance away. Stated another way, we will see a peak at frequency “X”, another at “X+Y” and a third at “X-Y” The peaks at “X+Y” and “X-Y” are called sidebands.
Why is this system non linear? Because “X+Y” and “X-Y” are not found anywhere in the input signal but they do appear in the output. The only thing in the input is “X” or the rate of the teeth impacting. These impacts go up and down in amplitude at a rate “Y”, but there is certainly no “X+Y” or “X-Y” in the input.
The off-centered gear may also cause Frequency Modulation because the effective radius of the off center gear changes as it moves closer and farther from the other gear. As the effective radius changes, the rate of tooth contact speeds up and then slows down repetitively. Frequency modulation is similar to amplitude modulation in that it also results in sidebands. In Amplitude modulation, the amplitude of the impacts go up and down in level repeatedly, in Frequency Modulation, the rate of impacts gets faster and slower repetitively. In this example, both would result in the same pattern in the spectrum.
Rolling element bearing wear, gear defects, and motor-bar defects will all produce sidebands. Rolling element bearings will also create non-synchronous tones. These are new peaks that are not exact multiples (harmonics of) the shaft rate.
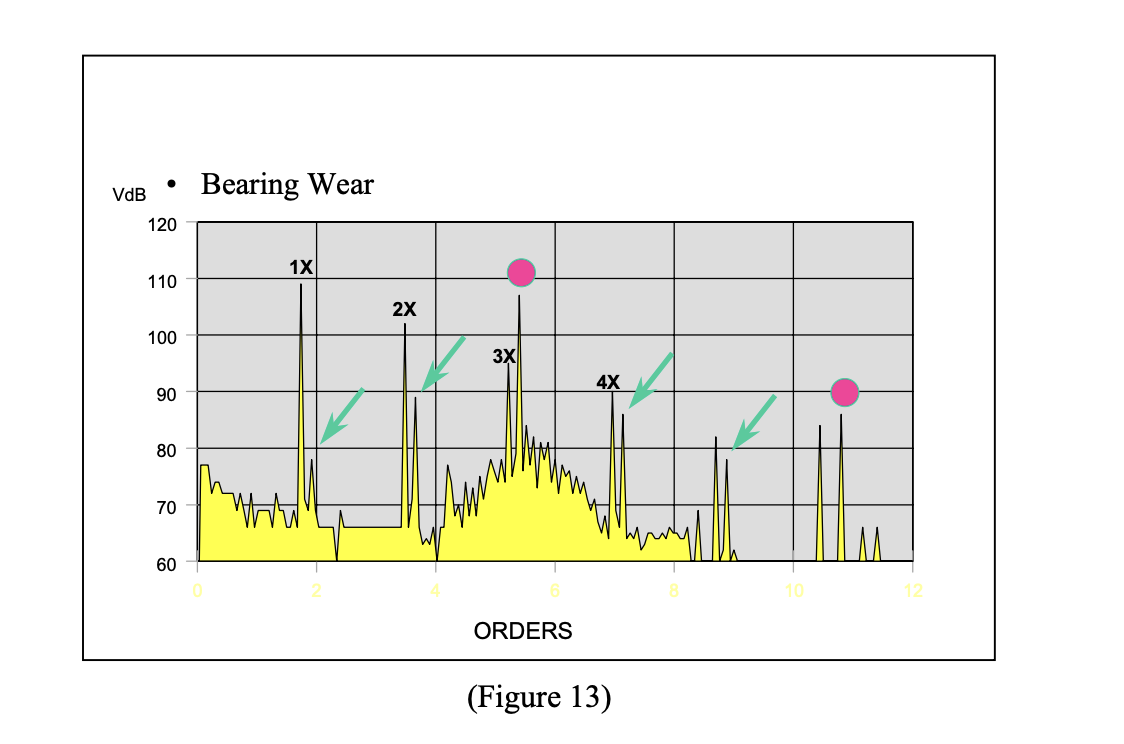
Figure 13 shows a machine with a serious bearing problem. Compare this to Figure 9 and note the peaks that are not related to the shaft speed (labeled 1x). The two peaks with circles on them are bearing tones and the peaks with the arrows are sidebands. In terms of linear systems, we can say that this spectrum represents a very non-linear response and suggests the machine has faults (which it does).
To understand why rolling element bearings create non-synchronous tones and sidebands, let us consider the case of a horizontal machine with an inner-race bearing fault. As the shaft and inner race spin, a certain number of balls will impact the fault on the inner race and will produce a peak in the spectrum equal to the number of impacts per revolution of the shaft. This peak is called a bearing tone. The number of impacts will almost never be an integral amount. In other words, there will be 3.1 or 4.7 impacts per revolution, but rarely exactly 3 or 5 impacts. Thus, the peaks will not be direct multiples of the shaft rate and are therefore termed “non-synchronous”. The peak marked with a circle in Figure 13, is an example of a bearing tone at 3.1x the shaft rate.
Considering this example further, we can also see that the weight of the shaft will cause the impacts against the fault to be greater in amplitude when the fault is below the shaft. As the fault on the inner race rotates to the top of the shaft, the impacts will be smaller because there is less weight (load) on the fault. In one revolution of the shaft the fault will travel around 1 time, into the load zone, out of the load zone and back into the load zone. Therefore the frequency of the change of amplitude in this case is equal to the shaft rate and this will also coincide with the spacing of the sidebands around the bearing tone. These peaks are labeled with the arrows in figure 13.
A similar phenomenon occurs if there is a fault on a ball or roller. We will see a bearing tone at a frequency equal to the number of impacts the fault on the ball makes with the races in one revolution of the shaft. This peak will also be non-synchronous and is called a bearing tone. The fault on the ball or roller also travels in and out of the load zone, however it travels at the cage rate, not the shaft rate. Therefore, the sideband spacing around the bearing tone will be equal to the cage rate, which is usually in the neighborhood of 0.3x the shaft rate.
Conclusion
The concept of linear and non-linear behavior gives us another way to think about a vibration spectrum and how its appearance relates to machine faults. Healthy machines should respond more linearly than machines with faults, which is to say, as machines develop faults they will likely respond less linearly. As they become less linear we begin to see more and larger harmonics and or sidebands in our spectra.
Because we may not know all of the details about the design of a machine or how its spectra will appear when it is healthy, it is still best to trend information over time. This is to say, look for more and larger harmonics and new peaks that were not there before as an indication that the health of the machine is deteriorating.
About the author: Alan Friedman has more than 18 years of engineering experience and has worked with hundreds of industrial facilities worldwide to develop best practices for sustainable condition monitoring and predictive maintenance programs. He has contributed to the development of automated diagnostic systems and produced and taught global CAT II and CAT III equivalent vibration analysis courses.