This is Part 2 of a two-part series adapted from the original paper “Mobility: A New Approach to Measuring Actual Forces in Machinery” by Alan Friedman & Glenn White. In Part 1, we explored why vibration levels can be misleading and introduced the concept of mobility. In this post, we’ll cover how mobility is measured, how it connects vibration to force, and what this means for machine health.
How Machines Behave – Some Definitions
Machines are complex structures, and they do not behave like a simple mass when exposed to a force. Machines always have natural frequencies, sometimes called resonances, where different parts of the structure are moving in different directions. These resonances occur at many frequencies. In general, it is easy to set a machine vibrating is you force it at a resonance fre- quency. This is analogous to pushing a child in a swing. The child-swing system is in resonance when you push it at the same frequency is its naturally vibrates.
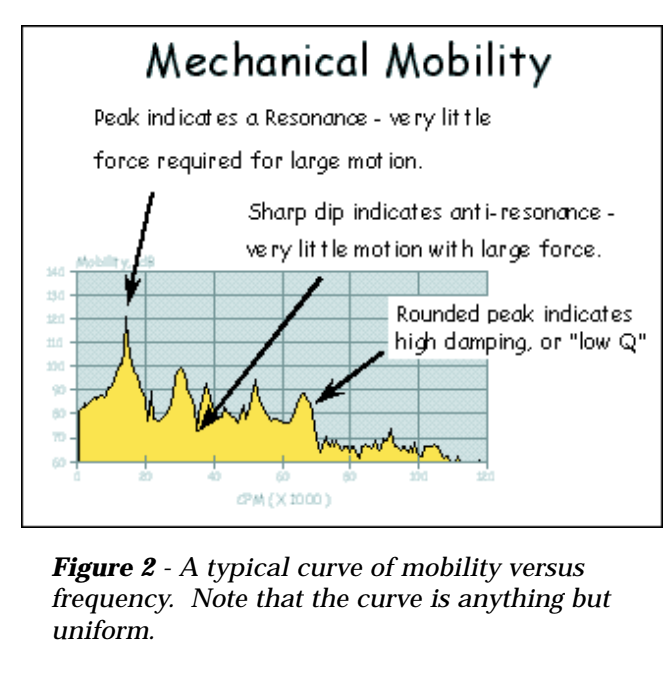
The resonance frequency is also where the mobility is relatively high… it is easy to move the machine with only a little bit of force. From this, you may have guessed that the mobility of a machine is not constant when measured at different frequencies, and this is absolutely true! Figure 2 below shows a typical curve of mobility versus frequency. Note that the curve is any- thing but uniform.
Mobility and Force
For those interested in the mathematics involved, mobility can be expressed as follows:
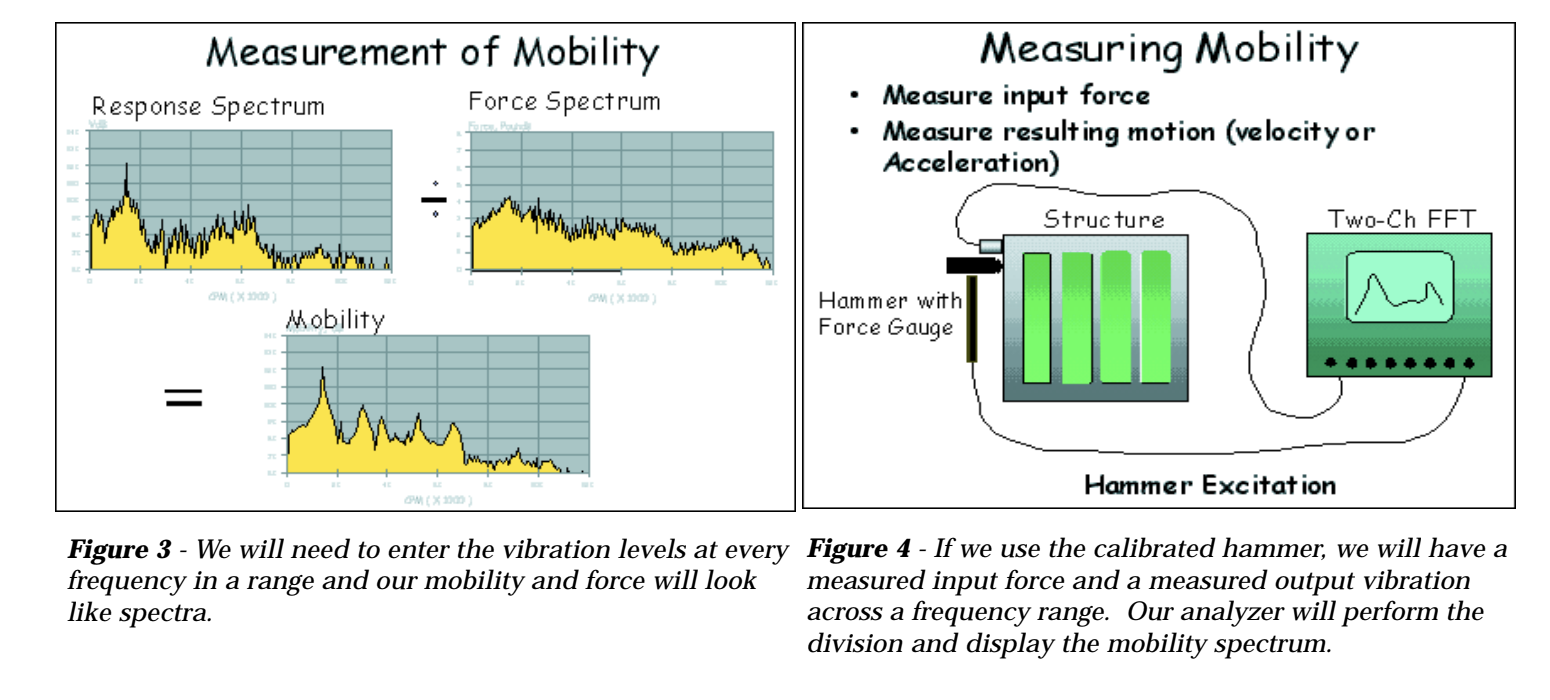
M=V/F (1) Mobility equals Vibration divided by Force (M=V/F). The vibration part of the equation can be in either acceleration or velocity and it is frequency related. In other words, unless we are only interested in mobility (or force) at one frequency, we will need to enter the vibration levels at every frequency in a range and our mobility and force will look like spectra (see Figure 3). Phase information will be included in these calculations as well, but we can leave that for now.
Let’s return to the first equation, M=V/F. Since the force is really what we are interested in, we should turn the equation around to be, F=V/M. If I am not writing this just to waste your time, it seems logical that there must be a way to calculate the mobility. Otherwise, we really haven’t said much! Lets look at that now.
We will also need a calibrated hammer or a shaker (Figure 4). If we use the calibrated hammer to hit the machine, we will have a measured input force and a measured output vibration across a frequency range. Our analyzer will be able to take care of the division and display the mobility spectrum.
Using Mobility to Calculate Force
Let’s assume at this point that we have calculated the mobility of the machine (in all three axis if possible) at every test position and have saved this information. Now when we go to collect vibration on this machine, we simply ask the analyzer to divide the vibration by the mobility spectrum (F=V/M). What we will now have is a force spectrum. And, even though there are as yet no industry standards that tell us what forces are allowable, we have a much better idea of the level of damaging forces in the machine. If we make the assumption that the mobility of the machine will not change dramatically over time (unless the mounting is changed or the machine is overhauled), we should only have to calculate the mobility once and simply store this information in our analyzer or analysis software for future use.
Some Data
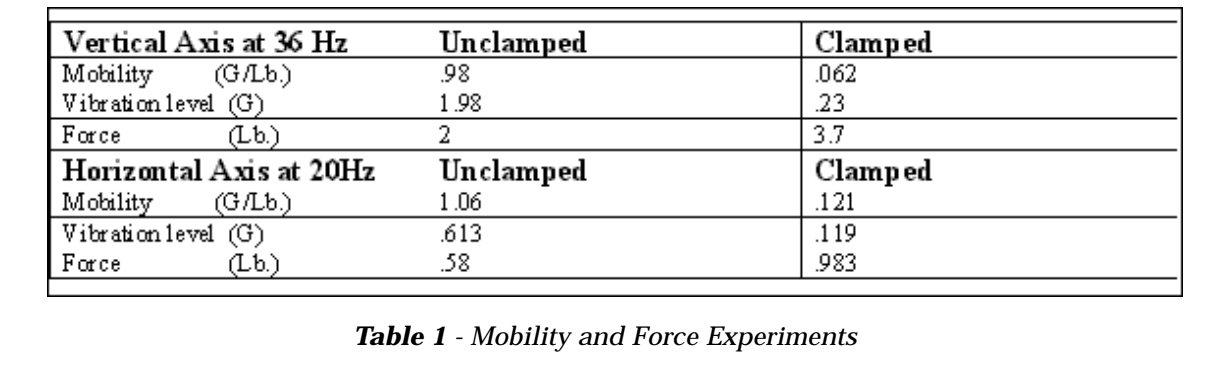
The table below contains some experiments we did to calculate mobility and force in a machine at two running speeds and in two axes. The configuration was similar to that shown in Figure 1 except the machine was horizontally oriented. The machine was tested normally for the first set of data and was then rigidly clamped to a table to collect the second set of data. One can see that in the clamped condi- tion, the forces in the bearings are nearly doubled in both tests while the vibration levels are only about 1/8 the level in the vertical direction and 1/5 in the horizontal direction. The run speeds selected for these tests coincide with resonant frequencies to further dramatize the results. It is apparent in this example that force and vibration have an inverse relationship. The test with higher vibration levels has lower damaging forces and vise versa. Again, it is the force that is related to the life span of these bear- ings, not the vibration!
OK, Vibration Can Still Be Useful!
If we assume that what I have written above is true and we really cannot know the condition of the machine on the first test by looking at its vibration alone, it doesn’t mean we cannot see how it is changing over time. If we assume that the machine’s mobility does not change from test to test, we can say that if the 1x peak rises, the machine is “more out of balance” than before; even if we did not know its original state of imbalance.
That may be enough – especially if the goal is to avoid catastrophic failure. We will certainly see the vibration spectrum change as the machine deteriorates. In the context of a predictive maintenance program, this is really the information we are interested in anyway.
A better approach takes this idea a step further by averaging data from machines that appear to be healthy. A standard deviation is added onto the average and new data is compared to this baseline. Statistically speaking, when you get above this one deviation level (and two deviations especially) one can say the machine is deteriorating. I believe this method is valid, but again, it does not address the issue of the machine’s condition the first time you test it.
A final approach that is often useful is to compare the spectra from two identical machines (if possible). If the machines are truly identical, including how they are mounted, we may be able to make the as- sumption that their mobilities are similar and therefore their vibration levels should be similar. If one of the machines displays higher vibration levels than the other we may be able to assume it is in worse condition.
Anecdotal Evidence
A large gearbox in a cooling tower was tested by one of our engineers. Excessive vibration levels of 132 VdB (approx. 1.6 in/s RMS) were cited at the shaft rate frequency. These excessive levels resulted in a strongly worded recommendation to overhaul the unit. One year later, the same engineer returned to the same site to test the machine again. Apparently, the site had opted to continue running the gearbox, and it had been in continuous use since the prior test. The engineer recorded the exact same vibration levels and was surprised that the machine had neither failed nor been overhauled. Intrigued by this seemingly inexplicable situation, the engineer investigated the possible explanations and noticed that the gearbox was mounted on a flimsy base of rotting wood.
The non-stiff base allowed the gearbox to vibrate, or in other words, it had a high degree of mobility. Dividing high vibration levels by high mobility would result in low forces and this would serve as an explanation for the machine’s continued trouble free operation. Unfortunately, the engineer was not equipped to calculate the mobility of the machine at that time and therefore this evidence is merely anecdotal.
Conclusion
Machines in the real world are not infinitely stiff and do not move as whole bodies. They bend, flex and contain resonances. Thus, machines do not respond uniformly to an input force or vibration at every frequency. Because of this, when we view a vibration spectrum it is distorted at almost every frequency by the machine’s structure. Some peaks may be unusually high because they fall on or near resonant frequencies while others will be unusually low because the fall on or near anti-resonant frequencies. There will be few peaks whose amplitudes are not effected one way or the other by the machine’s struc- ture (there are very few frequencies where the mobility is equal to one or the response is perfectly flat (Figure 2)).
What this implies is that if we are just looking at the vibration spectra, with no knowledge of mobility, we cannot really tell in which way or by how much the amplitudes of various peaks are effected. If we are using the amplitudes of these peaks to diagnose faults in the machine or make repair recommenda- tions, we may be missing the mark by a long shot!
One solution to this dilemma is to calculate the mobility of the machine at the test locations by dividing the response vibration by a known input force using a dual channel analyzer and a calibrated hammer. Dividing future vibration spectra by these mobility spectra to calculate the force spectra, we essentially remove the effects of the machine’s structure from our readings.
Another alternative is to use vibration analysis in a historical context, comparing new data as part of a trend plot, to mask alarms or to an average (plus 1 sigma) baseline all based on prior data from the machine. This solution makes the assumption that the machine’s mobility won’t change and that abso- lute vibration levels are not as important as changes in vibration levels at specific frequencies. This is simply another way of saying it is not necessary to know the condition of the machine on day 1, what is important is how its condition is changing over time.
This concludes our two-part series on mobility in vibration analysis. If you missed Part 1, start there to learn why vibration levels can be misleading and why mobility matters. Taken together, both posts show how looking beyond vibration gives us a clearer view of the forces that drive machine health.